History of bushfires in New South Wales
It has been an early and tragic start to the fire season in Australia. With unusually hot and windy weather combined with prolonged drought conditions, at least 2.7 million hectares has already been burnt this season, with many homes destroyed and at least six lives lost.
In this month's Open Data Insight, we look at fire history from the NSW Department of Planning, Industry and , which records fire data for NSW national parks and and the immediate surrounds (all other burn areas of the state are mapped by the NSW Rural Fire and are not included in the analysis below).
The data contains information such as total area burnt, fire perimeter length and geographic location about wildfires, and prescribed (i.e. controlled) burns from 1902 to the present (though not all features are recorded for every fire).
Recorded bushfires in NSW national parks and reserves (and surrounding areas), 1970-71 to 2018-19.
Are bushfires becoming more common?
As our population increases, suburbs and settlements are increasingly encroaching further into what was once bushland. And as the climate becomes warmer and drier, the risk of fires damaging property and threatening lives increases. So, when we look at fire history data, the obvious question seems to be: are bushfires becoming more common?
A simple way to determine this is to count the number of fire incidents recorded in the dataset. Because of the way the data is recorded, we’ll look at 'fire seasons', which roughly equate to a financial year.
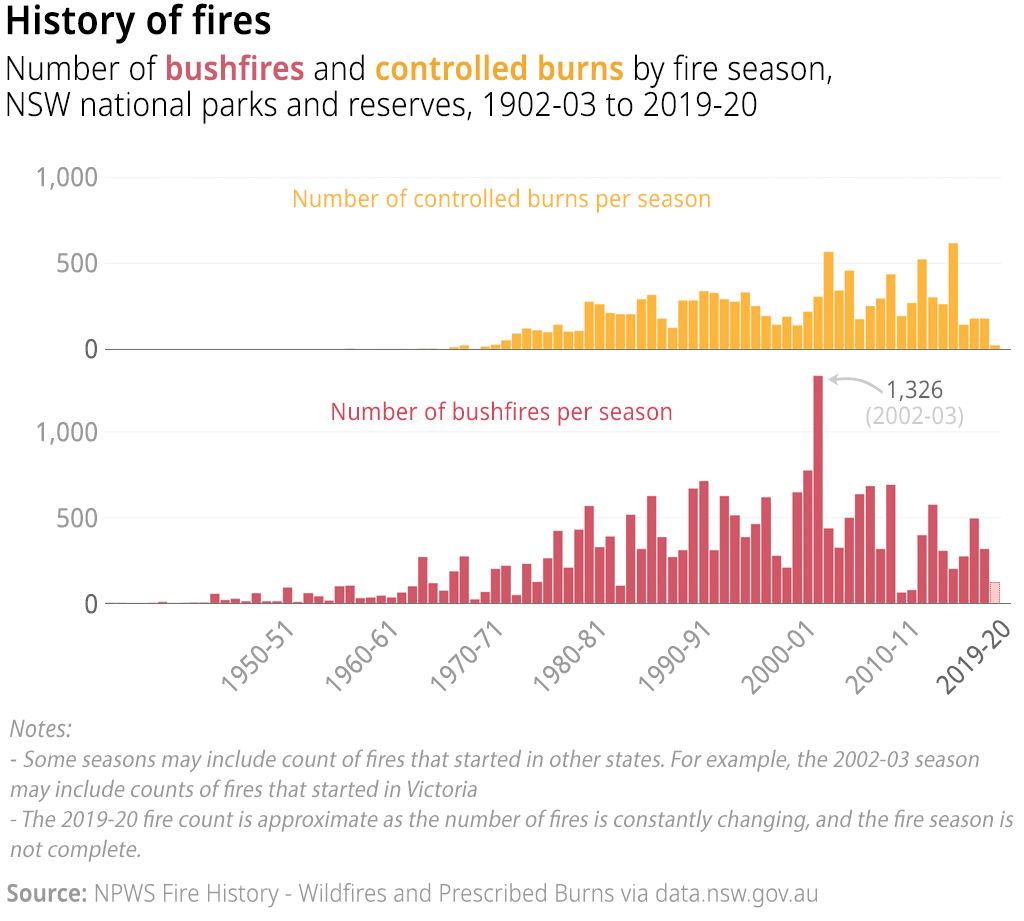
Number of bushfires and controlled burns in NSW national parks and reserves (and surrounding areas) per fire season, 1902-03 to 2018-19.
As you’d expect with data of this nature, early records are sparse, and it’s difficult to determine whether the low fire counts are due to there not being many bushfires or whether they were not recorded. The data is more detailed once satellites and other modern monitoring tools become available (and as human settlements venture further west in NSW, and people are there to report and record fires).
Therefore, we’ll limit our analysis to fires after 1970 as the data is more robust and complete.
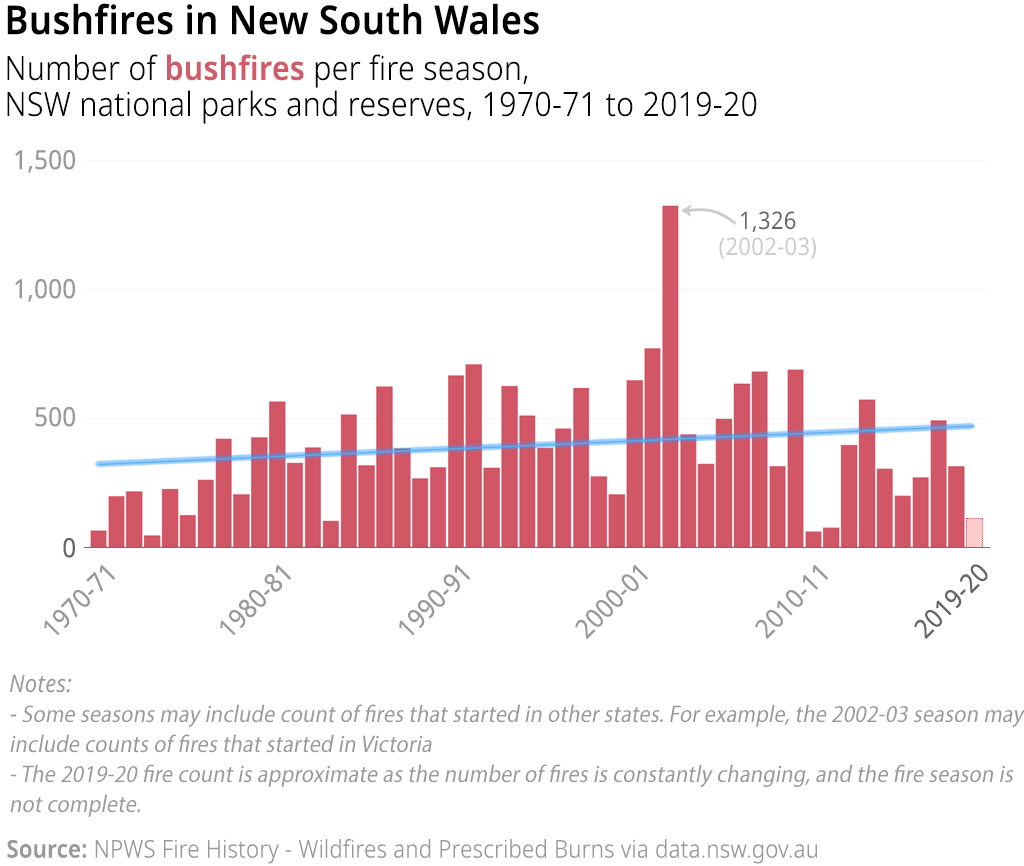
Number of wildfires in NSW national parks and reserves (and surrounding areas) per fire season, with a simple linear trend line in blue, 1970-01 to 2019-20.
We can see there does appear to be a slight increase in the number of bushfires from 1970 onwards, which is illustrated by the simple linear trend line (in blue). The chart shows that the number of wildfires increases from 1970-01 to the early 2000s, then stabilises, before decreasing after 2010-11.
In terms of number of fires, 2002-2003 was clearly a bad year — there were 1,326 individual wildfires. This was partly because large bushfires that started in Victoria, where the Millenium was already underway, pushed across the border.
The Millenium Drought in New South Wales roughly in 2001 and finished in 2010. Note the significant drop in the number of fires in 2010-11 and 2011-12. The current drought in NSW began in 2017.
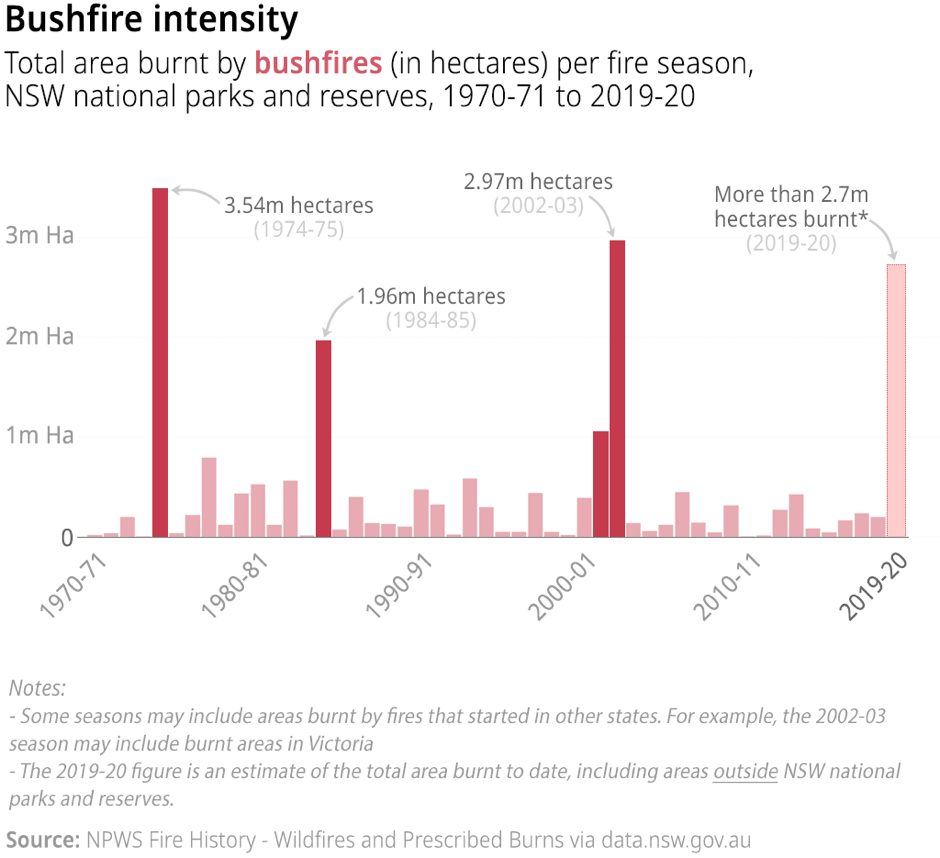
Now, what has happened to the intensity of bushfires since 1970? We’ll use the total area burnt as a proxy for intensity.
Total area burnt by bushfires in NSW national parks and reserves (and surrounding areas) per fire season, 1970-01 to 2018-19.
Firstly, as noted earlier, in 2002-03 large areas of New South Wales burnt due to fires that started in Victoria, and the chart above includes the areas burnt in Victoria (i.e. not just area burnt in NSW).
What’s alarming about this current fire season is that more than 2.7 million hectares have already in 2019-20, and the fire season has only just begun. There are more than 90 bushfires still across New South Wales.
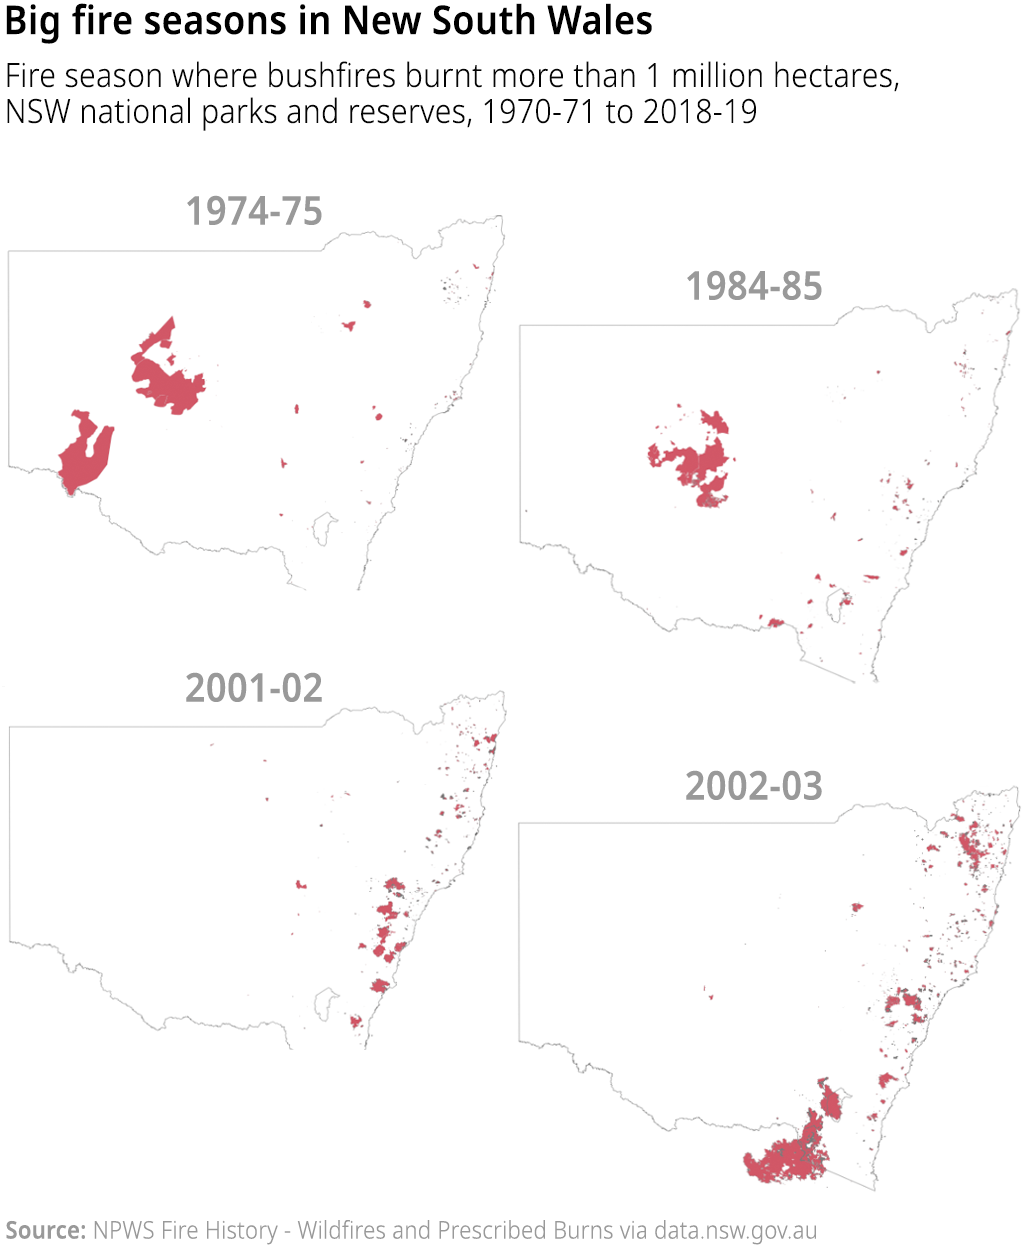
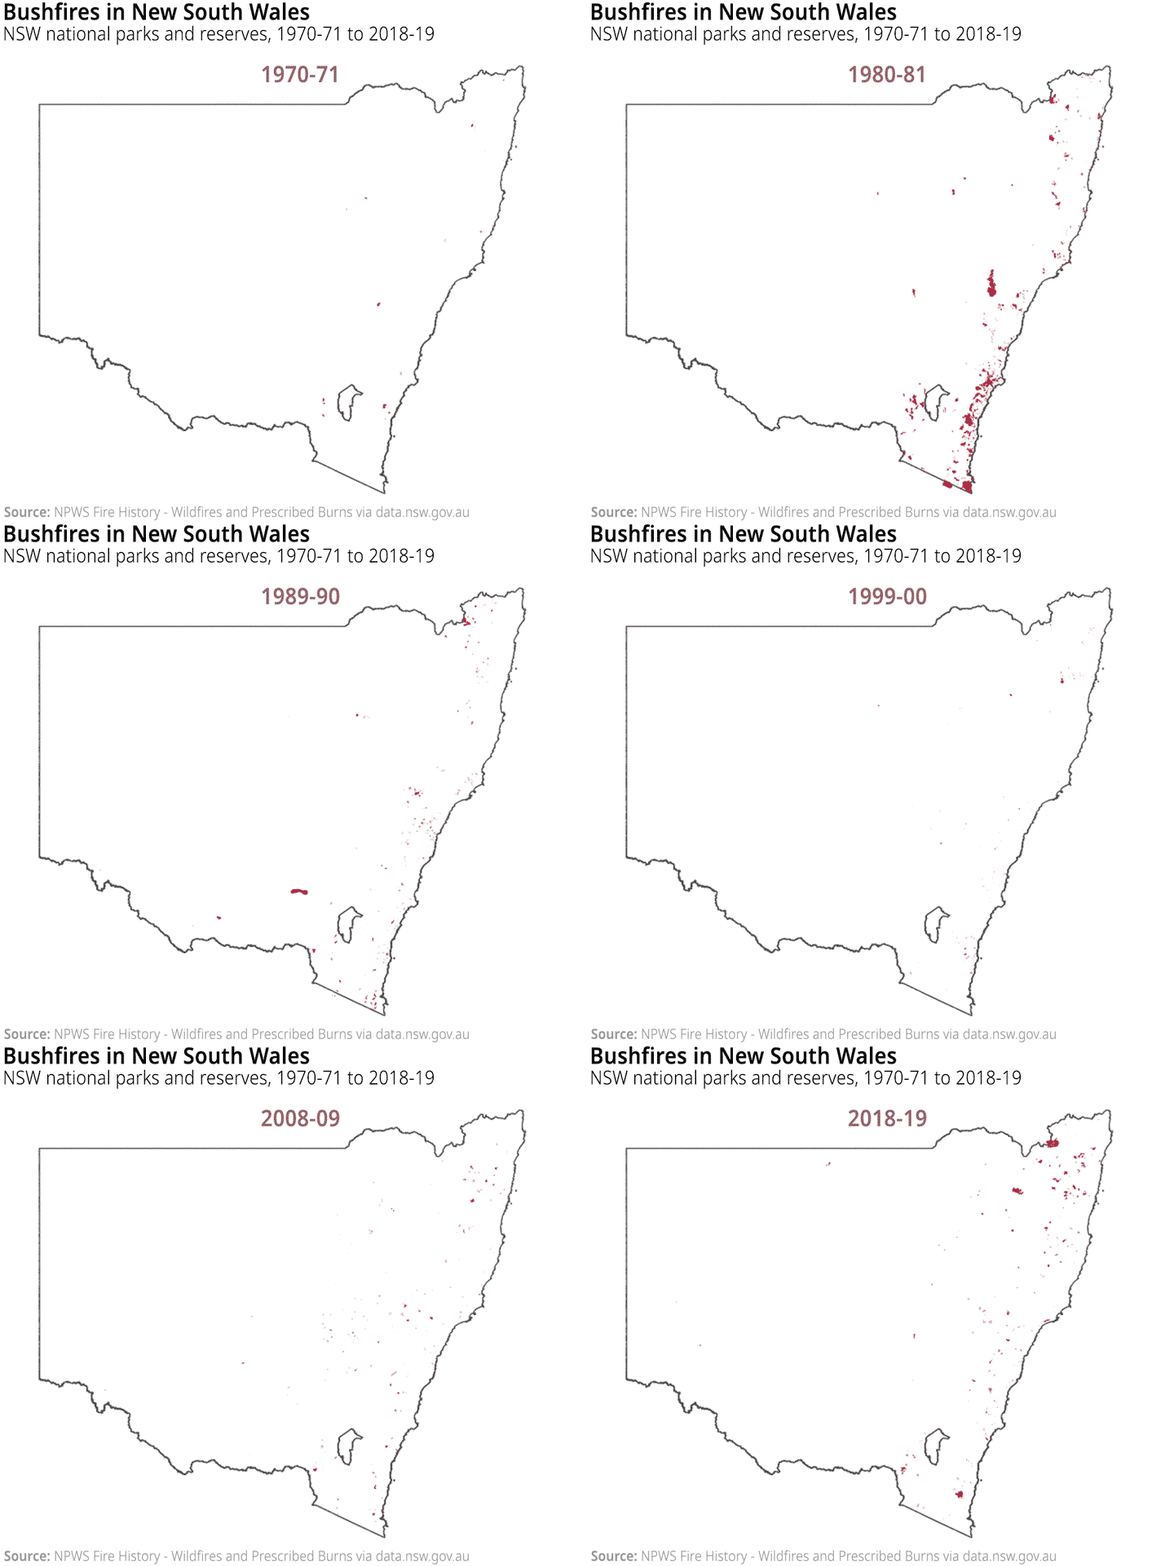
Let's look at the seasons where more than 1 million hectares were burnt, and see where those fires happened.
Locations of fires in NSW national parks and reserves (and surrounding areas) in fire seasons where more than 1 million hectares were burnt in total, 1970-01 to 2018-19.
Finally, we look at just how unusual it is to have bushfires of this size so early in the fire season.
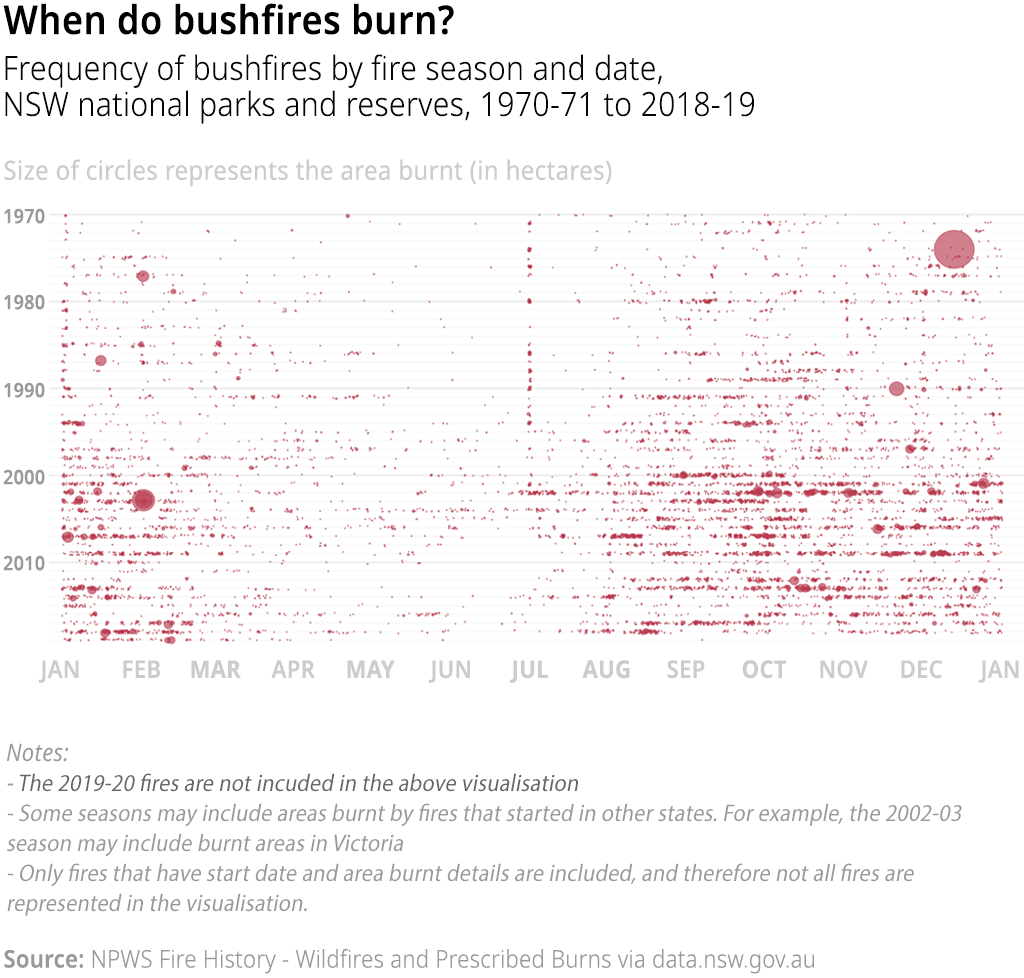
Frequency of bushfires in NSW national parks and reserves (and surrounding areas) by fire season and month. The size of dots represent the area burnt by each fire, 1970-01 to 2018-19. Note: only fires that have start date and area burnt details are included.
A word of caution about the above chart. It is only showing data for bushfires where the total area burnt and start date were recorded, and many bushfires are not included in the visualisation because of missing data. Therefore, it’s difficult to make accurate judgments, but some things are worth noting.
There are clearly more bushfire events from around 2000 onwards, and it was particularly intense around the time of the Millenium Drought as we have mentioned earlier. And while April through July are relatively quiet months in New South Wales, with the fire season really starting in August and ending in March, there are more individual wildfires throughout the year — not just in summer.
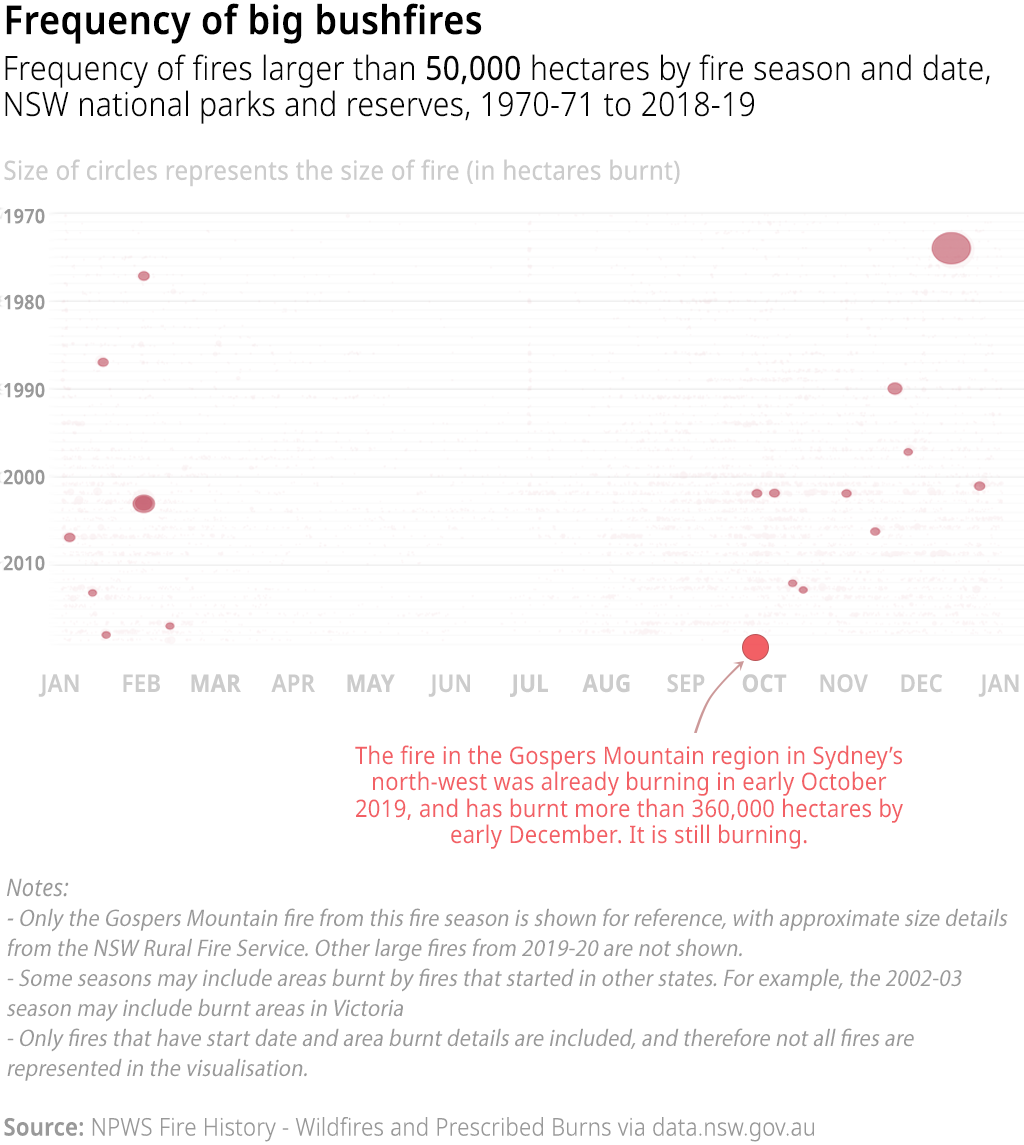
Let's just focus on larger fires. We arbitrarily chose 50,000 hectares to signify large — for reference, one of the larger fires this season (2019-20) is more than 360,000 . We have shown this fire below, but other large fires from 2019-20 are not included in the visualisation.
Frequency of bushfires larger than 50,000 hectares, by fire season and month. The size of dots represent area burnt by each wildfire, NSW national parks and reserves (and surrounding areas), 1970-01 to 2018-19. Note: Only fires that have a start date and area burnt details are included.
When we look at past fires over 50,000 hectares in size, we can see that such large fires are not common (though remember the caveat about excluded fires due to missing data). But they are becoming more common, especially after the year 2000.
What makes this fire season unusual is the sheer number of fires so early in the season, something fire officials they have not seen before. There were more than a 160 fires burning across the state in November.
This from The Guardian shows just how quickly the current bushfires have spread.
There is obviously more analysis we can do. The Bureau of Meteorology has rainfall , which we can cross reference with the bushfire data to see what impact droughts have on fire frequency and intensity. We can also use BOM's temperature data to see the impact of hot days on bushfires. But these are exercises we’re going to leave to you.
And if you do any analysis with this or related data, it would be great to hear from you.
The NPWS Fire History - Wildfires and Prescribed Burns data is from the NSW Department of Planning, Industry and Environment (via )


